

What is Data Analytics?
‘’Data Analytics in manufacturing is about analyzing data that are generated by machine and processes to identify common data sets and relations to arrive meaningful business insights. The business data may include transactions such as inventory update, financial transactions and operational system data like alarms, process parameters, and quality events, external data like customer, supplier, Web, and machine data to uncover new insights through advanced analytical tools’’.
Industry 4.0 or the ‘’Fourth Industrial Revolution’’ is revolving round the one central subject i.e., Data. Some experts are of opinion that data gathering and analyzing itself is called Industry 4.0 as it majorly involves harvesting of data or information received from sensors, aggregators, cloud computing and the Internet of Things.
‘Data Analytics’ is the pursuit of extracting logical data from raw data with the help of specialized techniques, like computational algorithms, machine learning models, visualization etc. This system transforms, organize, and model the data to draw a conclusion and identify patterns of a particular business or system. Data analytics in manufacturing refers to the techniques involved in analyzing raw data to enhance productivity.
Manufacturing is an untapped market for data analytics. It contains various types and high volume of data, and hardly a few data are being used for intelligence as of today.
This definition of Big Data Analytics has changed the traditional approach of most manufacturers dealing with manufacturing data. Big Data Analytics help the manufacturers to identify the parameters that had a direct impact on production. The application of Big Data Analytics in Manufacturing helps in processing information which enhances insights, helps with decision making, and automates processes.
5 steps to create a Data Analytics Pipeline is represented as follows
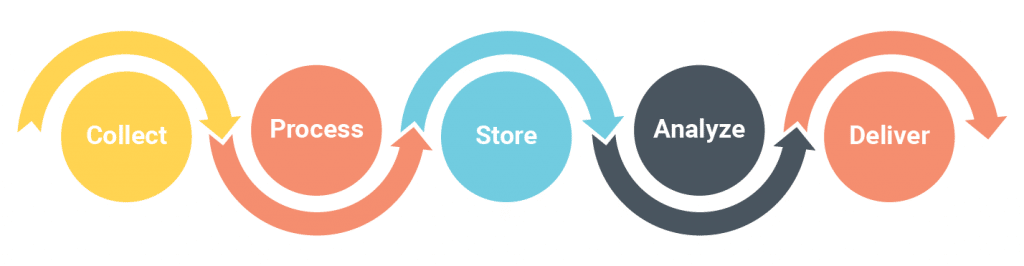
Step 1: Ingestion of the data from the data source.
Step 2: Process and enrich the data so your downstream system can utilize them in the format it understands the best.
Step 3: Store the data into a data warehouse or data lake for either long term archival or for reporting and analysis.
Step 4: Analyze the data by feeding them into analytics tools.
Step 5: Apply Machine Learning (ML) for predictions or create reports to share with your teams.
Types of Data Analytics –
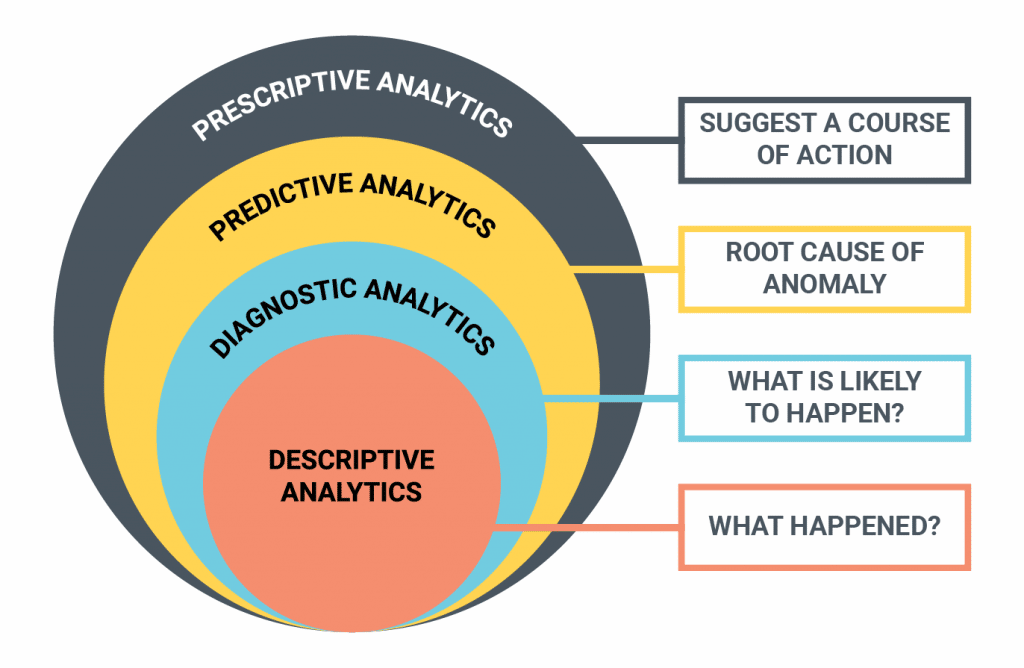
Descriptive:
It is the simplest type of Data analytics that allows you to pull trends from raw data and briefly describes what happened or is currently happening. Descriptive analytics looks at data and analyze past event for insight as to how to approach future events. It understands the performance by mining historical data to understand the cause of success or failure in the past. The descriptive analytics provides summarized value of the numerical variables.
Data aggregation and data mining are two techniques used in descriptive analytics to discover historical data. Data is first gathered and sorted by data aggregation in order to make the datasets more manageable for analysts. Data mining describes the next step of the analysis and involves a search of the data to identify patterns and meaning. Identified patterns are analyzed to discover the specific ways that learners interacted with the learning content and within the learning environment. Descriptive analytics provides vital information about a company’s performance. Companies use it to track their progress over time and compare performance with other businesses.
Descriptive analytics offers many advantages to businesses. It doesn’t require a deep understanding of analytical or statistical methods, and it can be performed with readily available tools. It can answer many of the most common questions about business performance, such as whether the sales were in line with goals. This helps the business to identify areas in need of improvement.
Descriptive analytics helps the business make more-informed decisions that guide the business in the right direction. Descriptive analytics is an essential technique that helps businesses make sense of vast amounts of historical data. It helps you monitor performance and trends by tracking KPIs and other metrics. While descriptive analytics focuses on summarizing and interpreting historical data, the other methods delve into the causes of trends and examine potential future outcomes and actions. Descriptive analytics sets the foundation for all your manufacturing insights.
Diagnostic:
The diagnostic analytics is about breaking down the available data and identifying the causes behind specific problems, events, and behavior. Drill-down, data discovery, data mining, and correlations are some of the popular techniques used in the diagnostic analysis. Diagnostic analytics is useful for getting at the root of an organizational issue. Manufacturers can leverage this data for a variety of purposes, such as drilling into the root causes of production inefficiencies, shipment delays or inventory shortages and many more.
Diagnostic analytics is also known as Root cause analysis because of its emphasis on cause and effect. Diagnostic analytics, like descriptive analytics, relies on historic data. Its distinguishing trait, however, is that it seeks to detect and explain anomalies and outliers. Diagnostic analytics makes use of a variety of methods, including probability theory, regression analysis, clustering analysis, filtering, time-series analysis, and more. The diagnostic analytics approach for identifying the root cause of an issue or trend usually has the following three steps.
a) To Identify the anomalies: When you initially look at some events and trends, they may not make much sense. one must diagnose these occurrences in order to determine the factors that led to the anomalies.
b) Drill into the information: In diagnostic analysis, only a few data are valuable, and it may not be evident which data may assist in identifying the causes for an anomaly. To figure it out, the analysts must investigate not only existing datasets but also other datasets that explain a comparable anomaly and determine how they can aid in diagnosing the related phenomenon. The necessary data can then be identified.
c) To Establish Causal connections: To establish causal connections, the relevant data can be subjected to data analysis techniques in order to find hidden linkages that contributed to the anomaly. Probability theory, regression analysis, filtering, and time-series data analytics are some of the techniques that can be applied. Data mining is critical in identifying previously unknown patterns that will help explaining what caused a specific event to occur, as diagnostic analysis is frequently used when an unexpected event or trend occurs.
Predictive:
The predictive approach of Data analytics shows what is likely to happen in the future. Predictive analytics use cases in manufacturing involves in real-time data monitoring that offer high fidelity and helps establish baselines, and alert stakeholders to changes faster than manual or devices that are not connected. Connected real-time devices are able to collect more data points. This further helps in predicting how much time or how many pieces can be produced before any failure. Predicting failures with data and manufacturing analytics reduces unplanned downtime.
Manufacturers commonly utilize predictive analytics to order materials and schedule production based on customer demand, making it useful for avoiding stockouts or waste. Predictive analytics becomes increasingly accurate as more data is collected and correlations are made. It helps manufacturers predict the maintenance schedule, reduces unnecessary equipment’s downtime, and make necessary adjustments before a failure occurs.
Predictive Analytics in manufacturing follows the below techniques:
i) Data capture: The first step in any data analytics strategy is to actually capture the data. This can come from machines, sensors or even workers on the plant floor.
ii) Data conversion: Once the data has been captured from all these sources, it must be unified into a single source. That means converting units of measurement, combining automated info with user-entered data, translating insights from multiple manufacturing systems and more.
iii) Advanced analytics: Next, predictive analytics software incorporated with artificial intelligence and machine learning creates a “story” about issues on the plant floor, complete with a beginning (what happened before the event), a middle (what the event looked like) and an end (what solution was chosen at the time and how effective it was).
iv) Translated insights: At this point, you have a lot of data about the past. That’s why the final step in the predictive analytics process is to translate this data into actionable insights about the future — essentially, using those previous stories to help you write a better sequel.
Perhaps the most significant benefit of any predictive analytics tool is its ability to improve efficiency across your manufacturing plant. The idea is to help you learn from your past to create a better future, and that means perfecting your approaches, identifying strengths and weaknesses, optimizing your workflows, and making better use of your time.
Prescriptive:
The prescriptive data analytics suggests a course of action after analysing the data. It aims to prescribe a certain analytical path for the organization. Prescriptive analytics can tell the organization how to overcome future challenges. It is the highest level of optimal manufacturing analytics solution. Prescriptive Analytics helps manufacturers see where process improvements could have the biggest, most immediate impact on their bottom lines.
Prescriptive Analytics is considered to be the most advanced form of Data Analytics. Simulation, Optimizations and Machine Learning techniques are broadly classified under Prescriptive analytics. These are used in each and every manufacturing value chain component so that organizations can avoid any type of failure in future.
In procurement functions, prescriptive analytics helps organizations decide the optimum sourcing locations, optimum inbound logistics route, optimum quantity to procure, simulated procurement cost and savings, projected KPI values, and other parameters. In planning functions, prescriptive analytics helps manufacturers determine the optimized quantity of multi-level inventory, optimized production schedule per proper capacity utilization, scenario planning, and simulated cash flow for various scenarios. In distribution functions, prescriptive analytics helps decide the optimum outbound logistics route, select right distribution center or warehouse, optimize truck loading, simulated cash flows, and others.
Prescriptive analytics techniques such as decision optimization can tackle highly complex problems ranging from hundreds to millions of constraints and variables that could never be analyzed manually. Decision optimization helps manufacturers in maximizing decision value, production planning, supply chain management, detailed scheduling, inventory optimization, maintenance scheduling.
Importance of Data Analytics in Manufacturing
With the advent of digital technologies and AI and ML, the collection and use of data has taken on new importance. Data from inside and outside the factory now has real value and without its collection, storage and use, manufacturers cannot remain competitive or effectively interface with customers and suppliers.
Big data in manufacturing helps manufacturers getting high production efficiency, better prediction of anomalies, and getting competitive advantage. Hence, manufacturing big data analytics has taken a significant place in shop floor. It involves extracting meaningful data from the massive data. Manufacturing companies are using big data and data analytics to automate, power, and streamline the operations.
Benefits of Data Analytics in manufacturing
The benefits of big data in manufacturing ranges from several preventive level advantages to aiding predictive decisions. Manufacturing industries often record the runtime, downtime and work queue for various assets and analyze the data to plan the workloads and machines operation. Big Data helps manufacturers to reduce processing flaws, improve production quality, increase efficiency, and save time and cost.
Following are the key benefits of data analytics in manufacturing :
a) Enhance production and services: Real-time data can be collected from multiple sources across the supply chain and factory and combined with ML and visualization tools can deliver insights across the business. Using effective analytics tools can help manufacturing companies to improve both production efficiency and product quality. Manufacturing data analytics helps the manufacturer know the amount of production to be required to fulfil the market demand. It helps businesses to optimize their performance as a whole.
b) Cost-reduction: Big data can benefit manufacturing companies by reducing the tests required to enhance product quality. This further results in decreased manufacturing cost.
c) Supply-chain management: As supply – chains become more complex, they generate large volume of data. Data is received from different sources like ERP systems, supplier end, shipment details etc., making it important for companies to utilize big data tools and optimize their supply chain. With the help of big data analytics, companies can have real-time monitoring of their products.
d) Demand Projection: Big data analytics for manufacturing helps in determining and projecting the demand of a particular product. Companies manufacture products based on forecasts provided by the analytics tools and eliminate or reduce production downtime and losses.
e) Machine level traceability and compliance measurement: Manufacturing analytics software helps in efficient assets management that increase assets’ lifetime improve asset availability and prevent unplanned downtimes. Data analytics can significantly improve assembly-line efficiency. For example, a pin-point defect scan can help in defect elimination leading to vastly improved quality and increased productivity.
f) Customers satisfaction: Keeping track of products after sale helps manufacturers understand customer responses and reduce condition-based monitoring. With the help of big data analytics, it is possible to avoid recall issues. This ultimately leads to customer satisfaction and increased product and brand reputation.
SFactrix.ai and Manufacturing Analytics:
SFactrix.ai is an advanced MES/MOM software solution with intelligence that provides real-time data of assets’ performance, availability, and quality of production by analyzing assets data. SFactrix integrated with built-in IoT support provides Manufacturing analytics solution that measures various parameters of production floor to visualize production efficiency. It focuses on predictive analysis of assets maintenance and health that helps in increasing factory’s operational efficiency and avoids unpredicted downtime.
SFactrix.ai is a user-friendly manufacturing software solution to enable quick configuration of the plant organization setup. SFactrix is a cloud software that requires no technical skill to operate, no download or installation.
Conclusion
Data Analytics give manufacturers insight by identifying patterns, measuring impact, and predicting outcomes. The ability to analyze equipment failures, production bottlenecks, supply chain deficiencies, etc., enables better decision-making. In addition to the general sources of generating data like loyalty programs, online marketing analysis, and social media monitoring, the industry is using a range of manufacturing analytics software to collect the data.
The data sets which the software and machines generate then can be used to form patterns, identify the problem areas, and come up with data-backed solutions. The Manufacturing Analytics market is projected to grow at 16.5% CAGR by 2026 and the fastest in North America.
The current global manufacturing analytics market size is about $5.9 billion, which is predicted to reach $28.5 billion by 2026. As manufacturers gain a better understanding using available data analytics, the possibility for improvements is endless. Taking the first step toward harnessing data analytics can be a daunting one, but the end result – the digital factory and all its rewards – are well worth the journey.